Research
Discussion Paper
PIERspectives
aBRIDGEd
PIER Blog
Events
Conferences
Research Workshops
Policy Forums
Seminars
Exchanges
Research Briefs
Community
PIER Research Network
Visiting Fellows
Funding and Grants
About Us
Our Organization
Announcements
PIER Board
Staff
Work with Us
Contact Us
TH
EN
Research
Research
Discussion Paper
PIERspectives
aBRIDGEd
PIER Blog
The Differential Impact of Aging on Structural Change: Insights from Cross-Country Analysis Based on Income Levels
Latest discussion Paper
The Differential Impact of Aging on Structural Change: Insights from Cross-Country Analysis Based on Income Levels
FDI มากขึ้น แต่ไทยได้ประโยชน์น้อยลง?
Latest PIER Blog
FDI มากขึ้น แต่ไทยได้ประโยชน์น้อยลง?
Events
Events
Conferences
Research Workshops
Policy Forums
Seminars
Exchanges
Research Briefs
The Curse of a Strong Dollar
Latest PIER Research Exchange
The Curse of a Strong Dollar
Who Gets It Wrong? Inflation Dynamics Following a Misperceived Energy Price Shock
Latest PIER Research Exchange
Who Gets It Wrong? Inflation Dynamics Following a Misperceived Energy Price Shock
สถาบันวิจัยเศรษฐกิจป๋วย อึ๊งภากรณ์
Puey Ungphakorn
Institute for
Economic Research
Puey Ungphakorn Institute for Economic Research
Community
Community
PIER Research Network
Visiting Fellows
Funding and Grants
PIER Research Network
Funding & Grants
Funding & Grants
About Us
About Us
Our Organization
Announcements
PIER Board
Staff
Work with Us
Contact Us
Staff
Staff
ดร.กรรณิการ์ ธรรมพานิชวงค์ ร่วมเสวนาในหัวข้อ “เจาะอุตสาหกรรมเกษตรภาคเหนือ เปลี่ยนผ่านอย่างไรในวันที่โลกไม่เหมือนเดิม”
Latest announcement
ดร.กรรณิการ์ ธรรมพานิชวงค์ ร่วมเสวนาในหัวข้อ “เจาะอุตสาหกรรมเกษตรภาคเหนือ เปลี่ยนผ่านอย่างไรในวันที่โลกไม่เหมือนเดิม”
PIER Blogblog
QR code
Year
2026
2025
2024
2023
...
/static/a13d1b9d3cab515b6d50c5d067b26372/e9a79/049.png
9 April 2018
20181523232000000
PIER Statistics Series

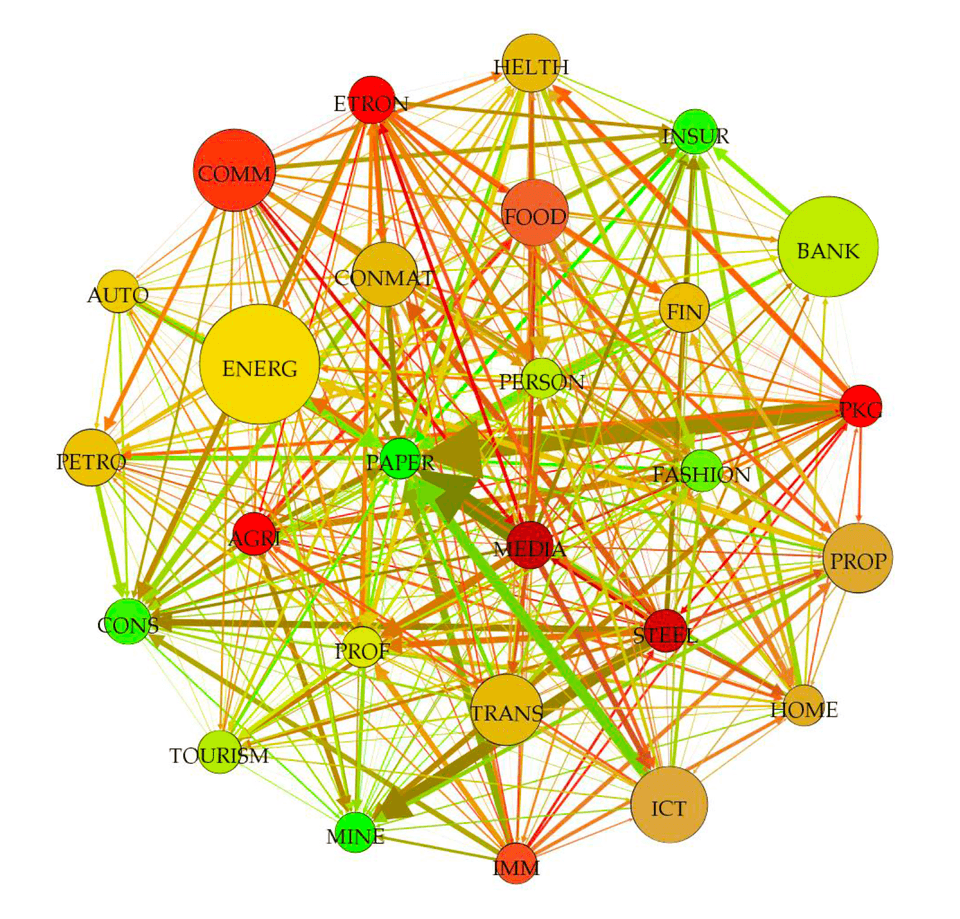
Measuring interconnectedness among business sectors in SET
Bhumjai Tangsawasdirat

049

ที่มา: รายงานการประเมินเสถียรภาพระบบการเงินไทย 2560

กราฟแสดงผลจากการวัดความเชื่อมโยงระหว่างภาคธุรกิจด้วยวิธี Diebold-Yilmaz ซึ่งเป็นการวัดความเชื่อมโยงผ่านความผันผวน (volatility spillover) ของราคาหลักทรัพย์ โดยมีพื้นฐานจากการทำ variance decomposition จากแบบจำลอง vector autoregression (VAR) ทั้งนี้ ในการคำนวณได้ใช้ข้อมูลราคาหลักทรัพย์ของบริษัทจดทะเบียน 522 บริษัท จาก 27 หมวดธุรกิจ ในช่วงปี 2547–2560

กราฟประกอบด้วย node และ edge โดยที่

  • ขนาดของ node สะท้อนขนาดสินทรัพย์ของหมวดธุรกิจ และสีของ node สะท้อนค่า net connectedness โดยรวม ซึ่งสะท้อนบทบาทโดยสุทธิของแต่ละหมวดธุรกิจว่าเป็นผู้รับหรือส่งความเสี่ยงให้กับระบบ (สีเขียวสะท้อนว่าเป็นผู้รับความเสี่ยง ส่วนสีแดงสะท้อนว่าเป็นผู้ส่งออกความเสี่ยง)
  • ความหนาของ edge สะท้อนค่า net connectedness

หมายเหตุ:

  1. คำนวณโดยบดินทร์ ศิวิลัย และอนุชิต เอื้ออารักษ์ โดยอ้างอิง methodology จาก Diebold, Francis X., and Kamil Yilmaz. “On the Network Topology of Variance Decompositions: Measuring the Connectedness of Financial Firms.” Journal of Econometrics 182, no.1 (2014): 119–134.
  2. แบ่งหมวดธุรกิจตามตลาดหลักทรัพย์แห่งประเทศไทย ไม่รวมหมวด Property Funds และ REITs (คำอธิบายชื่อย่อหมวดธุรกิจในตารางแสดงโครงสร้างกลุ่มอุตสาหกรรมและหมวดธุรกิจของตลาดหลักทรัพย์แห่งประเทศไทย)
Bhumjai Tangsawasdirat
Bank of Thailand
The views expressed in this workshop do not necessarily reflect the views of the Puey Ungphakorn Institute for Economic Research or the Bank of Thailand.

Puey Ungphakorn Institute for Economic Research

273 Samsen Rd, Phra Nakhon, Bangkok 10200

Phone: 0-2283-6066

Email: pier@bot.or.th

Terms of Service | Personal Data Privacy Policy

Copyright © 2026 by Puey Ungphakorn Institute for Economic Research.

Content on this site is licensed under a Creative Commons Attribution-NonCommercial-ShareAlike 3.0 Unported license.

Creative Commons Attribution NonCommercial ShareAlike

Get PIER email updates

Facebook
YouTube
Email